
Average Power vs. Peak Power: When Each Measurement Matters
July 24th, 2026
9 min. read | By Katie Wright
Topics:
Your meter says one thing. Your system is doing another.
You take a reading. It looks reasonable, roughly what you expected, so you move on. But there's a question worth asking before you trust that number: what kind of power did you actually measure?
Average power and peak power aren't interchangeable. Using one when the job calls for the other is one of the more common ways RF measurements end up misleading the person taking them.
This article gives you the clarity to know which measurement you need, why it matters, and what you are missing when you reach for the wrong one.
Core differences
Every RF signal has power. But power is not a single fixed value in most real-world systems. It varies. Sometimes slowly. Sometimes dramatically. And the way you characterize that variation determines whether your measurement is useful or misleading.
Average power captures the mean energy of a signal over time. It accounts for the full waveform, including the moments of high power and the moments of low power or silence, and gives you a single number that represents what the signal is doing on average.
Peak power captures the maximum instantaneous power in a signal. The highest point. The crest of the wave before it comes back down.
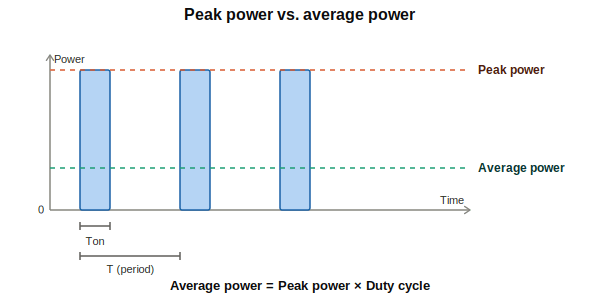
Duty cycle is what ties the two together. It's the fraction of time the system is actively "on," and it's the multiplier that turns a peak reading into an average one (or vice versa).
That said, duty cycle only works cleanly for signals that are genuinely on-or-off, like radar or TDMA bursts. For waveforms whose envelope varies continuously — AM, voice, QAM, OFDM — there's no clean "on" fraction to point to, so a different tool is needed: crest factor and PAPR, covered next.
Key measurement relationships
Duty cycle handles the on/off case. For everything else - any signal where the envelope rises and falls continuously rather than switching cleanly between two levels - the relationship between peak and average is expressed as crest factor, the ratio of a signal's peak voltage to its RMS voltage.
- Crest factor is a quick way to gauge how far apart your peak and average readings should be before you even measure: a signal near 1:1 (CW) needs little worry about sensor type, while anything with a high crest factor is a flag to double-check that your instrumentation can keep up.
Crest Factor = Vpeak / Vrms - PAPR, or peak-to-average power ratio, is the power-domain counterpart — peak power divided by average power — and it's the term you'll see specifically in the context of digital modulation. It's usually expressed in decibels:
PAPR (dB) = 10 log₁₀ (Ppeak / Paverage)
A CW signal sits at a PAPR near 0 dB, since peak and average are nearly identical. A high-order QAM or OFDM signal can run 8–12 dB or more, meaning the peaks can be an order of magnitude above the average — which is exactly why these signals are hard to measure accurately without the right sensor.
Crest factor and PAPR describe the exact same underlying concept — the ratio of a signal's peak amplitude to its average — just expressed in different units: crest factor as a voltage ratio, PAPR as a power ratio. Which term you hear tends to depend on who's talking. Audio, power systems, and test equipment engineers working with voltage waveforms and time-domain meters favor crest factor. RF, wireless, and digital modulation engineers working on systems like OFDM, LTE, or 5G favor PAPR, since link budgets and transmitter specs are managed in power terms from the start.
A few common cases:
- Pulsed RF: this is the duty-cycle case from above where Paverage = Ppeak × Duty Cycle. It's really a special case of PAPR: for a clean rectangular pulse, PAPR works out to 1/duty cycle.
- AM and voice signals: Average power runs well below peak, typically landing somewhere in the 2:1 to 4:1 range depending on the modulation scheme. Voice content pushes the peaks higher than a steady tone would, which is part of why this ratio isn't fixed.
- Digital modulation — QAM, OFDM, and similar: These schemes carry high peak-to-average power ratios (PAPR), with the envelope shifting rapidly and unpredictably. Capturing that behavior accurately requires a true-average power meter — anything less either misses the peaks or misreads the average, as covered in the diode-sensor problem below.
When average power is the right measurement
Average power is the measurement most RF technicians reach for most of the time, and in most applications it is exactly the right choice.
FM and analog voice systems. A conventional FM transmitter produces a signal with a relatively constant envelope. The power level stays steady. Average power measurement gives you an accurate, stable, meaningful reading. It tells you what the transmitter is producing, what the feedline is carrying, and what the antenna is radiating.
Digital voice systems: DMR, P25, NXDN. Modern land mobile radio protocols use digital modulation. These signals have more complex waveforms than analog FM, but average power is still the measurement that matters for characterizing overall system performance, verifying transmitter output, and assessing antenna system health. What changes is how you measure that average accurately, which we will come back to.
Continuous transmitters and broadcast systems. A broadcast FM or AM transmitter running continuously needs average power measurement to verify it is operating at its licensed power level. Regulatory compliance is defined in average power terms. Peak power is a secondary concern.
System efficiency and heat. The thermal load on a transmitter, a feedline, and an antenna is determined by average power. If you are asking how hot something is going to run, average power is the number you need.
In short: if your question is about what the system is doing over time, average power answers it.
When peak power is the right measurement
Peak power becomes essential when instantaneous power levels matter independently of the average.
Radar systems. Radar transmits in short, intense pulses. The peak power of those pulses determines how far the radar can see and how well it can resolve targets. The average power, calculated across the time between pulses, is much lower and tells you almost nothing useful about radar performance. A radar system might have 1 megawatt of peak power and only a few kilowatts of average power. Measuring average power and declaring the system healthy would miss the point entirely.
Pulsed industrial RF. Semiconductor manufacturing processes, plasma systems, and certain medical RF applications use pulsed RF energy where the peak power level determines process outcomes. Average power tells you how much energy is being deposited over time. Peak power tells you whether the instantaneous intensity is sufficient to do the work.
Component stress and ratings. Every RF component has a peak power rating alongside its average power rating. Connectors, cables, switches, and amplifiers can handle a certain average power continuously, but they can also be damaged by instantaneous peak power levels that exceed their ratings, even briefly. If you are sizing components or investigating a failure, peak power is the number that determines whether something was overstressed.
TDMA and burst transmission systems. Time-division multiple access systems like some P25 Phase 2 configurations transmit in bursts. During the active burst, instantaneous power is high. Between bursts, it drops to zero. Peak power tells you what the system is doing during the burst. Average power, measured across the full duty cycle, gives you a much lower number that may not reflect the actual stress on components during transmission.
If your question is about instantaneous intensity, component ratings, or pulse characteristics, peak power answers it.
The trap that catches good technicians
Traditional power sensors, including most diode-based wattmeter elements and slugs, are calibrated for continuous wave signals. On a CW signal, average and peak are the same thing, so calibration is straightforward.
Digital modulation changes this. Signals like DMR, P25 Phase 2, and LTE have complex waveforms with a high peak-to-average power ratio. The envelope of the signal varies significantly from moment to moment. A diode-based sensor responds faster to instantaneous signal levels than a thermal sensor does, and its response curve is nonlinear at higher power levels.
The result is that a traditional diode sensor measuring a digitally modulated signal produces a reading that is influenced by the shape and peaks of the waveform rather than its true average. The meter shows a number. The number is plausible. But it may differ meaningfully from the actual average power the system is producing.
This is not a hypothetical problem. It is a documented measurement error that affects technicians working on digital LMR systems every day, most of whom have no idea their readings are off.
What true-average measurement means and why it matters
True-average measurement isn't about swapping in a different sensor technology wholesale — it comes down to whether the sensor's response tracks the signal's actual mean power or gets pulled around by its peaks. Diode sensors can do this correctly, but only inside their square-law region, typically somewhere in the neighborhood of −70 dBm to −20 dBm depending on the diode. In that window, the diode's output voltage is proportional to the square of the input voltage, which is exactly the relationship average power measurement needs, so the reading holds up regardless of waveform shape.
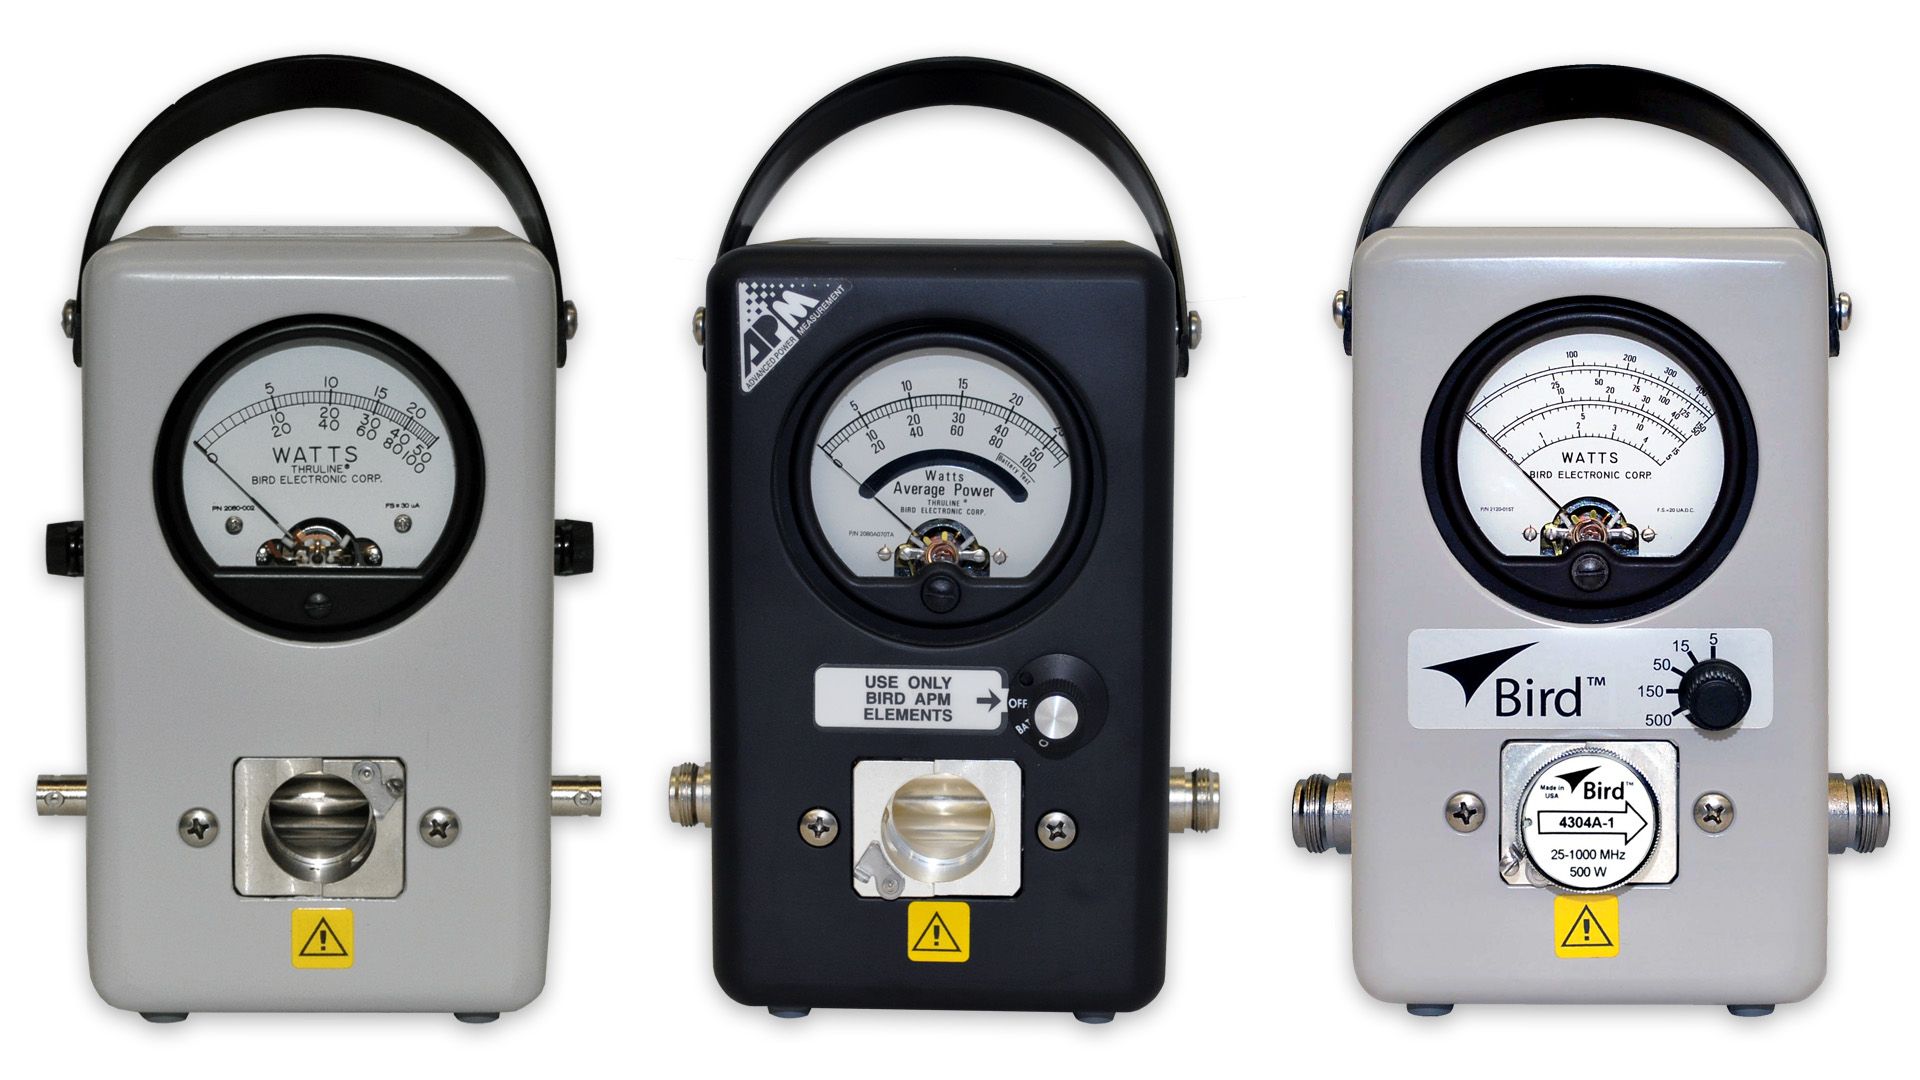
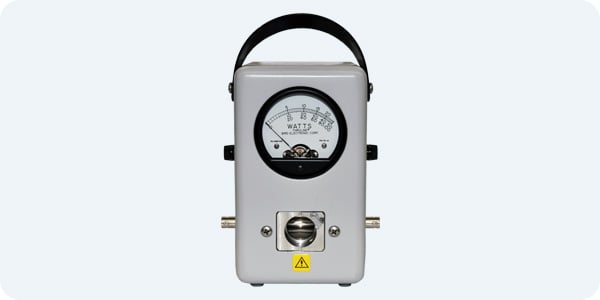
Bird's CW sensors & wattmeters are a good example of this in practice: they're diode-based, not thermal, and their accuracy comes from staying inside that square-law window rather than from any heat-sensing mechanism. That works well for CW and constant-envelope FM, where the signal's peaks never stray far from its average and everything stays comfortably within the diode's square-law range — the Model 43, for instance, is built and calibrated specifically around that assumption, which is exactly why it's a CW-only instrument.
The trouble starts with high-PAPR signals — DMR, P25 Phase 2, LTE, anything with a large peak-to-average power ratio. Even when the average power sits well within a sensor's rated range, the instantaneous peaks can push the diode above the square-law ceiling and into its nonlinear region. Once that happens, the reading starts tracking crest factor instead of true average power. Two signals with identical average power but different peak structure can come back with different readings, and the error is large enough to matter.
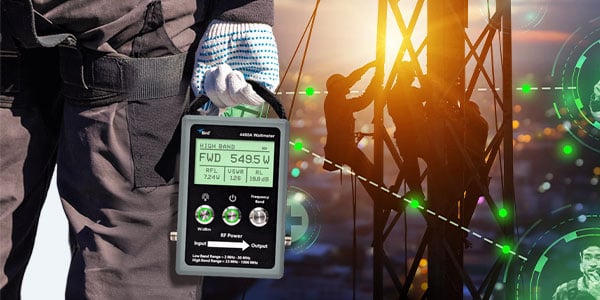
Bird's 4480A wattmeter takes a different approach to the same diode technology: it uses a Schottky diode kept in its square-law region across a much wider range of signal types, so it delivers true average readings on both CW and digitally modulated signals — DMR, P25, LTE, and similar — without needing the swappable elements the Model 43 relies on. Same underlying physics as any square-law diode sensor; the difference is in how the sensor and its circuitry are designed to stay in that region across a wider range of envelopes.
For anyone working digital radio systems, knowing where a diode sensor's square-law region ends — and whether your signal's peaks actually stay inside it — matters as much as knowing its frequency and power range. Without that, you're making calls about system health based on numbers that might not reflect what's actually happening.
Picking the right tool
When you pick up a meter at the start of a job, ask yourself two questions.
- What kind of signal is this? CW or analog FM — a standard diode sensor is fine. Digitally modulated — you need true-average capability.
- What am I actually trying to learn? Verifying transmitter output, antenna health, or regulatory compliance — measure average power. Evaluating component stress, characterizing a pulsed system, or checking for instantaneous overstress — measure peak power.
Most field measurement in LMR and broadcast comes down to accurate average power measurement of digital signals. That is the gap that most traditional instrumentation leaves open, and it is worth closing.
What this means for how you work
The technicians who get the most out of RF measurement are not the ones with the most meters. They are the ones who understand what each measurement is actually telling them and reach for the right tool for the situation in front of them.
Average power and peak power are not competing measurements. They are complementary ones. Each answers a different question. And knowing which question you are trying to answer before you take a reading is what separates a measurement that gives you confidence from one that gives you a number.
The system in front of you is telling you something. The right measurement is what lets you hear it clearly.
Frequently asked questions
What is the difference between average power and peak power? Average power is the mean RF energy of a signal measured over time, accounting for all variations in the waveform. Peak power is the maximum instantaneous power level. For a CW signal they are essentially equal. For pulsed or digitally modulated signals they can differ significantly.
When should I measure average power vs peak power? Use average power to verify transmitter output, assess antenna system efficiency, and confirm regulatory compliance. Use peak power to evaluate component stress ratings, characterize pulsed RF systems like radar, and understand burst power levels in TDMA systems.
What is true-average power measurement?
True-average power measurement is a reading that reflects a signal's actual mean power over time, no matter how its waveform is shaped or modulated. The term "true" is doing real work here — it's distinguishing this from a reading that only looks like an average but is actually being skewed by the signal's peaks.
There are two ways to get there. A diode sensor can produce a true-average reading, but only while it's operating in its square-law region, roughly −70 dBm to −20 dBm, where the diode's output is proportional to the square of the input voltage, which is mathematically the same thing as power. Stay inside that window and the reading holds regardless of whether the signal is CW or a high-PAPR digital waveform like LTE. Push the peaks above that ceiling, and the diode drifts into its nonlinear region, where the reading starts tracking crest factor instead of average power. That's the mechanism behind instruments like Bird's 4480A, which is built to keep a Schottky diode in square-law operation across both CW and digitally modulated signals.
A thermal sensor gets to the same result by a different physical route: it measures the heat the RF energy generates, and heat is inherently proportional to average power, independent of envelope shape.
Different mechanisms, same outcome — a number that represents what the signal is actually doing, not just what its peaks look like.
Why do diode sensors give inaccurate readings on digital signals? Diode sensors are calibrated for CW signals with constant envelopes. Digitally modulated signals have varying envelopes with higher peak-to-average power ratios. The sensor's nonlinear response to envelope variations produces a reading that is neither true average nor true peak, introducing measurement error.
What is peak-to-average power ratio? Peak-to-average power ratio (PAPR) is the ratio of a signal's maximum instantaneous power to its average power. CW and analog FM signals have low PAPR. Digitally modulated signals like LTE and OFDM-based systems have high PAPR, which increases measurement error when using traditional diode sensors.
How are average and peak power related? For a pulsed system, average power equals peak power multiplied by duty cycle. A system with 1 megawatt peak power and 1 percent duty cycle has an average power of 10 kilowatts. This relationship is a useful cross-check when both measurements are available.
Ready to go deeper?
Katie is an electrical engineer with more than 30 years of experience in RF test and measurement. She specializes in high-power RF measurement, product strategy, and technical thought leadership. During her time at Bird, she wrote about RF measurement accuracy, calibration, and the applications of high-power RF systems. She is also a licensed amateur radio operator (KD8FAD).
Explore Posts by Topic:
Products Featured:
Contact an RF Expert at Bird
Connect with a solutions expert for knowledgeable guidance.