

The Antenna Passed. So Why Is Coverage Getting Worse?
A radio infrastructure site serving a regional dispatch center begins showing reduced coverage at the edge of its service area. Complaints come in gradually — first from one sector, then two. A maintenance team visits, sweeps the antenna, and finds VSWR well within specification. Return Loss looks acceptable. Reflected power is low. By the standard checklist, the antenna system passes.
Coverage continues to deteriorate.
Three months later, a more thorough investigation reveals moisture intrusion in the main feeder cable. Attenuation has increased significantly over an extended run. Power is being dissipated in the cable before it ever reaches the antenna. The antenna itself is fine. The transmission path between the transmitter and the antenna is not.
The measurements were not wrong. The sweep showed a correctly matched antenna. But it could not reveal that a significant portion of power was being lost before it reached the antenna feed point. VSWR describes what is happening at the impedance interface. It does not describe what is happening along the path leading to it.
What VSWR and Return Loss Actually Measure
VSWR and Return Loss both describe impedance mismatch — the degree to which a source and load fail to present the same impedance to each other. When impedances are matched, power transfers efficiently and little is reflected. When they are not, some energy is reflected back toward the source. Both metrics quantify that reflected fraction, just through different mathematical lenses. Return Loss carries an added wrinkle worth understanding on its own: depending on convention, it can be expressed as either a positive or negative number — here's why.
What they do not measure is equally important to understand. Neither VSWR nor Return Loss directly measures delivered power, cable loss, connector integrity, antenna radiation efficiency, or coverage performance. They describe a ratio at a specific measurement point. Everything upstream and downstream of that point is invisible to both.
This is not a criticism of the measurements — it is a description of their scope. Used correctly, with that scope understood, they are genuinely valuable diagnostic tools. Used as a proxy for overall system health, they regularly lead experienced RF professionals to the wrong conclusion.
Fun Fact - Where Did VSWR Come From?
Long before network analyzers and digital power meters were available, engineers measured impedance mismatch the hard way — with a slotted line. A slotted line was a section of coaxial or waveguide transmission line with a narrow longitudinal slot cut along its outer conductor, through which a small probe could be inserted and moved to sample the electric field at any point.
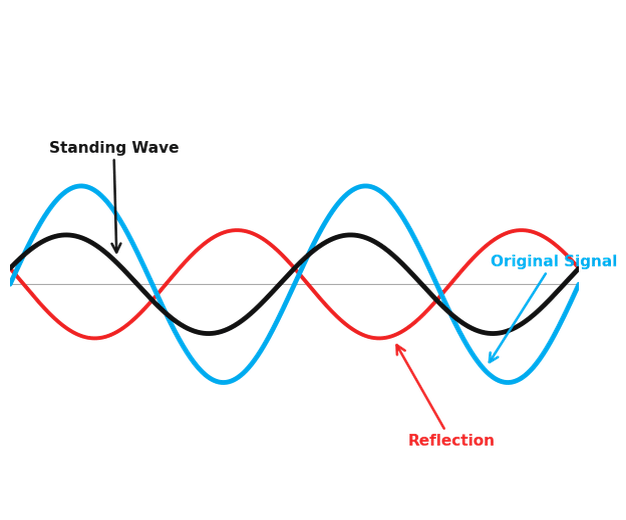
When a mismatched load was connected, forward and reflected waves combined to create a standing wave pattern — a series of voltage maxima and minima at fixed positions. By sliding the probe and reading field strength on a galvanometer, an RF professional could measure the maximum and minimum voltage values directly. The ratio of those two values — Vmax divided by Vmin — is exactly what VSWR expresses, which is why the measurement is called the Voltage Standing Wave Ratio in the first place.
The slotted line was the dominant impedance measurement tool from the 1930s through the 1960s, widely used in radar development during World War II and throughout the microwave boom that followed. Today's network analyzers compute the same ratio electronically in milliseconds, but the name — and the voltage-ratio convention — remains a direct inheritance from a probe sliding along a slotted piece of brass.
So why measure VSWR or Return Loss at all? Because within their scope, they are fast, non-invasive, and genuinely informative. A return loss sweep at commissioning establishes a baseline that makes every future measurement meaningful. A spot-check reading that has shifted from a previous value is an early warning that something has changed — even if it does not identify what. A severe mismatch reading immediately points to a load or connection problem that would otherwise require extensive investigation. The issue is not that VSWR and Return Loss are unreliable — it is that they are routinely asked to answer questions they were never designed to answer.
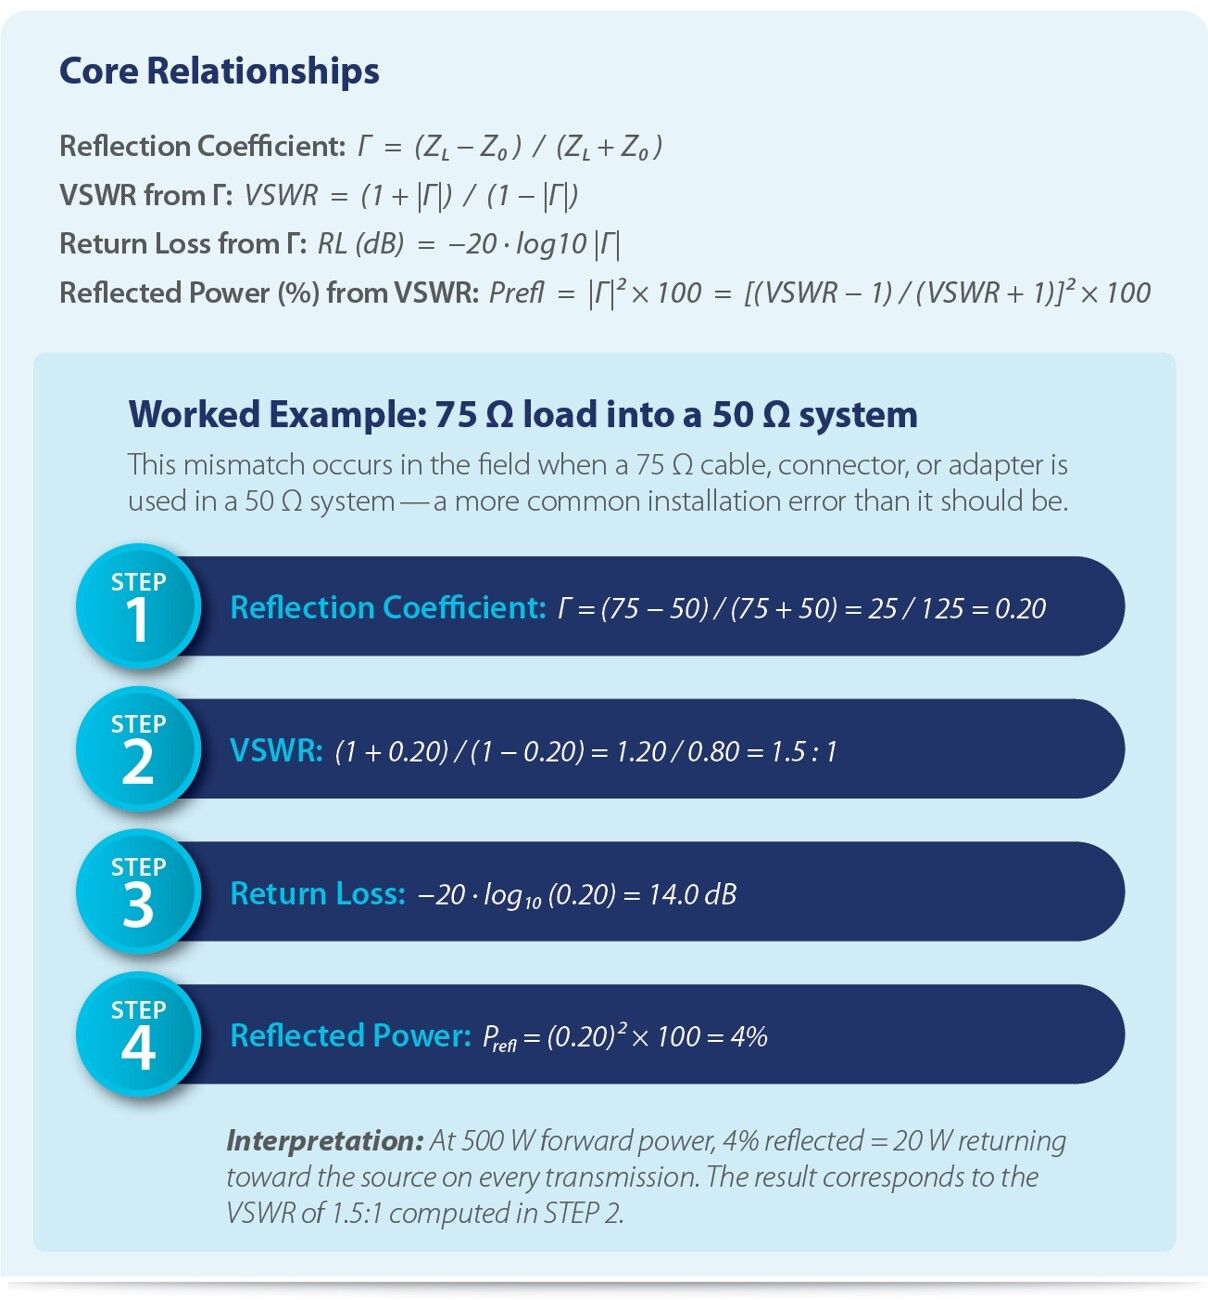
Both express the same physical reality in different units. The relationships between them are fixed and worth knowing — the callout below shows the full set with a worked example.
VSWR vs. Return Loss: Resolution Where It Matters
VSWR and Return Loss carry the same information but distribute it very differently across the scale. VSWR compresses the well-matched end of the range where most maintained systems operate. The difference between 1.1:1 and 1.2:1 looks small as a ratio, but those values represent 26.4 dB and 20.8 dB respectively — a 5.6 dB spread that is immediately legible and diagnostically meaningful in logarithmic form.
The table below shows the full relationship between VSWR, Return Loss, and reflected power across the range relevant to real-world RF systems. Note how VSWR resolution collapses at the good-match end while Return Loss remains linear and readable throughout.
This resolution difference is one reason many system integrators specify Return Loss — not VSWR — for antenna system acceptance testing on critical communications infrastructure. VSWR remains the dominant field convention globally and will appear in equipment specifications and maintenance documentation throughout a career in RF. Fluency in both, and the ability to convert between them quickly, is a practical necessity.
Table 1: VSWR, Return Loss and Reflect Power comparison
|
VSWR |
Return Loss (dB) |
Reflected Power (%) |
Practical Context |
|
1.05:1 |
32.3 dB |
< 0.1% |
Excellent — near perfect match |
|
1.1:1 |
26.4 dB |
0.2% |
Very good — typical new installation |
|
1.2:1 |
20.8 dB |
0.8% |
Good — acceptable for most systems |
|
1.5:1 |
14.0 dB |
4% |
Acceptable — monitor for trends |
|
2.0:1 |
9.5 dB |
11% |
Marginal — investigate cause |
|
3.0:1 |
6.0 dB |
25% |
Poor — significant mismatch |
|
5.0:1 |
3.5 dB |
44% |
Severe — system fault likely |
The Line-Loss Masking Effect: When Good VSWR Is a Warning Sign
One of the most counterintuitive phenomena in RF troubleshooting is what happens to mismatch measurements when transmission line loss increases. Understanding this effect is essential for anyone maintaining high-power RF systems — and it is the direct explanation for the scenario that opened this article.
Under normal conditions, reflected energy from the antenna travels back along the feeder toward the transmitter and measurement instrument. The reading represents the actual mismatch at the antenna, modified only by the small round-trip loss of a healthy cable.
When cable attenuation increases — due to moisture ingress, aging, jacket damage, or connector corrosion — the cable attenuates both forward and reflected power. By the time the reflected signal returns to the measurement point, it has passed through the lossy cable twice. Measured reflected power drops. VSWR improves. Return Loss increases.
The result is paradoxical: as the cable degrades and delivers less power to the antenna, the mismatch reading at the transmitter suggests everything is getting better. The table below shows two systems with identical transmitter-end measurements — and completely different performance realities.
Table 2: Comparison of two systems with a VSWR of 1.4:1.
|
Parameter |
System A (Healthy) |
System B (Degraded) |
|
Feeder Cable |
New, low loss |
Aged, moisture ingress |
|
Connector Condition |
Properly terminated |
Oxidized, degraded |
|
Cable Attenuation |
Within spec |
Elevated — energy lost as heat |
|
Measured VSWR |
1.4:1 |
1.4:1 |
|
Measured Return Loss |
15.6 dB |
15.6 dB |
|
Actual Delivered Power |
High |
Significantly reduced |
|
Reflected Power at Source |
Low |
Low (masked by line loss) |
|
Coverage / Performance |
As designed |
Reduced — problem hidden |
Both systems show 1.4:1 VSWR and 15.6 dB Return Loss at the transmitter. One is healthy. One is delivering significantly less power to the antenna because its feeder is dissipating energy as heat. The transmitter-end measurement cannot distinguish between them.
The line-loss masking effect is particularly consequential in aviation maintenance environments. When an aircraft communication or navigation system reports degraded performance, the pressure to return the aircraft to service is immediate — every hour on the ground has a direct operational cost. A technician connecting a wattmeter at the avionics bay output and finding normal forward power and acceptable VSWR has apparent evidence that the radio system is functioning correctly. That measurement may be entirely accurate. The antenna feed point is a different story.
Aircraft RF installations present some of the most demanding physical environments in communications infrastructure. Coaxial cable runs are routed through wings, fuselage cavities, and equipment bays — bundled with other wiring, bent around structural members, and exposed to the full range of airframe temperature and vibration conditions. Connectors are mated and de-mated repeatedly during maintenance cycles. Water can enter the airframe through seal degradation and accumulate in cable runs that are effectively impossible to inspect without partial disassembly. A water-logged coaxial section buried in a wing root or a corroded connector deep in an avionics bay will attenuate both forward and reflected power — producing the exact line-loss masking signature described above. VSWR at the avionics bay looks acceptable. Reflected power is low. The antenna is receiving a fraction of what the transmitter is producing. And the clock is running.
This is one of the most instructive real-world expressions of the line-loss masking problem: a measurement taken at the most accessible location, under time pressure, confirming what the maintainer hoped to find — while the actual fault sits somewhere in an inaccessible cable run between the measurement point and the antenna.
Key Insight
As transmission line loss increases, measured VSWR improves and Return Loss increases — even as actual delivered power to the antenna decreases. A system degrading through cable loss can appear to be getting healthier when evaluated only at the transmitter end. Unexplained improvement in VSWR should be investigated, not accepted.
The line-loss masking effect is a problem of measurement location — a reading taken at the wrong point in the signal path can actively misrepresent system condition. But location is not the only dimension in which VSWR can mislead. A measurement taken at exactly the right location can still give an incomplete picture if it is taken at only one frequency, or if it is evaluated without any historical reference point to compare it against.
Why Sweeping Across Frequency Reveals What Spot Checks Miss
A single VSWR or Return Loss reading tells you what is happening at one frequency. A sweep across the operating band tells you what is happening across all of it — and those two pictures are frequently very different.
RF performance is not constant across frequency. An antenna may present an acceptable match at the center of the operating band while degrading toward the edges. Water intrusion in a connector can create a frequency-dependent impedance variation that appears only at specific points in the band. Physical damage — element fatigue, radome cracking, structural settling at the antenna mount — typically shifts the antenna's resonant frequency rather than degrading performance uniformly.
A return loss sweep makes all of this visible: resonant frequency, operating bandwidth, the shape of the mismatch curve, and any anomalies suggesting specific hardware problems. Two antennas showing identical VSWR at a single spot-check frequency may have completely different sweep profiles — one broadband and stable, the other narrow and highly sensitive to environmental change.
Figures 1 and 2 show the return loss sweep of two antennas. Note that return loss is displayed as a negative number. The return loss for the antenna in Figure 1 is below the red limit for its operating bandwidth between points 1 and 2 and is performing satisfactorily. The sweep in Figure 2 shows that this antenna exceeds the limit line in a portion of its operating frequency band, indicating a problem with the antenna.
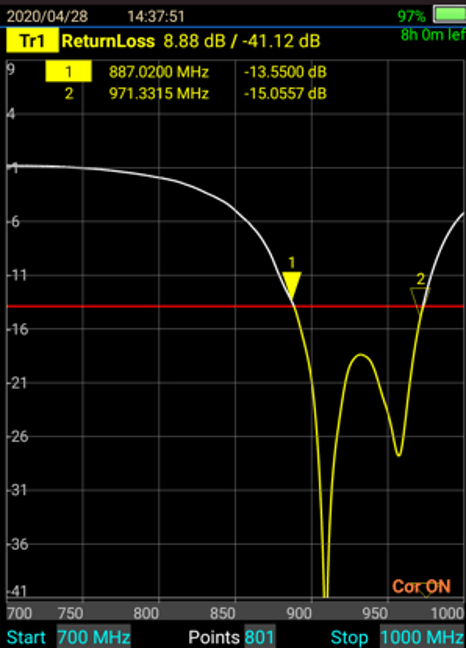
Figure 1: Antenna return loss sweep showing performance within limits over the operating system bandwidth of 890 - 970 MHz.
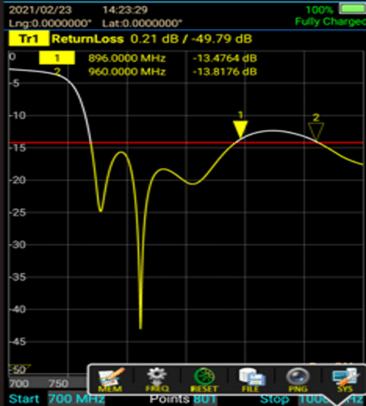
Figure 2. Antenna return loss sweep showing results between points 1 and 2 exceeding design limits.
For professional mobile radio (PMR) and critical communications systems operating across multiple channels within a licensed band, this matters operationally. A system that passes at the primary dispatch frequency but degrades at adjacent channels may be invisible to spot-check testing until user complaints arrive from those channels. Sweeping the full operating band at commissioning — and at regular maintenance intervals — provides a baseline that single-frequency readings simply cannot establish.
Acceptable mismatch does not guarantee acceptable performance. A system can have excellent impedance matching at every interface and still deliver significantly less power to the coverage area than it did twelve months ago — because the cable has aged, the connectors have corroded, the combiner has drifted, or the antenna has degraded. VSWR and Return Loss describe one dimension of system health. The complete picture requires combining mismatch data with power flow measurements, cable loss verification, and historical trend comparison.
The Complete Picture
No single RF measurement tells the whole story. VSWR and Return Loss confirm impedance match. Forward and reflected power measurements confirm energy flow. Cable loss measurements confirm transmission path integrity. Historical trend data confirms whether the system is stable or deteriorating. Used together, these measurements provide a complete picture of system health. Used in isolation, any one of them can be technically accurate and diagnostically misleading.
A Practical Approach to RF Signal Path Evaluation
Rather than asking 'is the VSWR good?' — a binary question that may be misleading — work through the following steps in sequence. Each one adds a layer of context that the previous cannot provide on its own.
1. Sweep the full operating band — not just a spot frequency.
Compare resonant frequency, curve shape, and Return Loss values to previous measurements. A shift in sweep profile — even when the absolute values still pass — is often the first measurable indication of a developing problem, appearing well before the mismatch value crosses a threshold. Single-frequency spot checks will miss this entirely.
Verify power flow through the transmission path.2. Verify power flow through the transmission path.
Measure forward power at the transmitter output and, where accessible, at the antenna feed point. The difference is the actual insertion loss of the feeder. Compare this to the cable's specified attenuation for the operating frequency and run length. An increase in measured loss relative to specification or baseline is a direct indicator of cable or connector degradation — independent of what the VSWR is showing. If loss has increased relative to baseline, the next step is locating where in the run the problem has developed.
Frequency Domain Reflectometry (FDR) — covered in detail in Part 3 — provides a distance-to-fault trace that pinpoints impedance anomalies anywhere along the feedline from a single connection point. The cable is disconnected from the transmitter and the FDR instrument connected in its place; everything downstream remains in place. No cutting, no segmenting, no guesswork about which section to inspect first.
3. Check for unexplained improvement.
If VSWR has improved or Return Loss has increased since the last measurement without any maintenance being performed, treat it as a warning rather than good news. As covered in the line-loss masking section above, improving mismatch readings are a common signature of increasing feeder loss. Investigate before accepting the result.
4. Assess trends over time
4. Assess trends over time.A single measurement tells you where the system is today. A series of measurements tells you where it is heading. Return Loss trending from 20 dB toward 15 dB over six months is actionable information — the cause can be found and corrected before performance degrades noticeably. The same 15 dB reading, seen for the first time at a routine inspection without that history, is a number you cannot fully interpret.
Field Reality
A good mismatch reading is necessary but not sufficient evidence of a healthy system. It should be confirmed by power flow measurements, cable loss verification, and comparison to historical data. When those data points agree, confidence in system health is justified. When they disagree — when coverage is declining but VSWR looks fine — the mismatch reading is telling you something narrowly accurate while the system is telling you something more broadly important.
Looking Ahead
The line-loss masking effect is one example of a broader category of RF system behavior: gradual, progressive degradation that is invisible to routine spot-check measurements until it becomes severe enough to generate user complaints. VSWR at the transmitter cannot detect a cable that is slowly deteriorating. Neither can a forward power reading.
Part 3 examines this problem directly — how RF systems degrade long before they fail, which measurements reveal the earliest warning signs, and why trending data tells you things that no individual reading ever can. For anyone responsible for maintaining RF infrastructure over time, it is where the measurement strategy changes from reactive to predictive.
Coming next - Part 3 or 7: Why RF Systems Often Degrade Long Before They Fail
Part 2 built on the groundwork laid in Part 1: Why Correct RF Measurements Can Still Be Wrong - worth a read if you want the full picture.
About the Author
Katie Wright is an electrical engineer with more than 30 years of experience in RF test and measurement. She specializes in high-power RF measurement, product strategy, and technical thought leadership. During her time at Bird, she wrote about RF measurement accuracy, calibration, and the applications of high-power RF systems. She is also a licensed amateur radio operator (KD8FAD).